
Abstract
Many storage vendor performance claims are based on artificial situations that can sometimes have little relevance to real world performance. Performance claims are one thing but what about actual customer computing environments? How well are HP AutoRAID disk arrays performing in the field? This presentation reveals new information sampled from field installations of HP AutoRAID indicating that many customers are experiencing the cost and performance benefits of hierarchic adaptive RAID.
Various performance statistics are maintained continuously within HP AutoRAID disk arrays. These are sampled periodically by the array manager utility and can be examined by system administrators. Samples of this information have been returned via email to the factory. This presentation is based on the analysis of performance data from over 30 systems with HP AutoRAID disk arrays.
Introduction
HP AutoRAID was invented to address disk array management problems that became evident in the late 1980ís. Specifically, owners of disk arrays did not know how best to configure them. Selection of RAID levels and stripe characteristics based on application characteristics was and is a black art. Even if an array is configured correctly, data access characteristics may change over time, causing performance degradation. The decisions and tradeoffs forced by most disk arrays make them frustrating and time consuming to configure. The need for simpler configuration is addressed primarily by the hierarchic RAID algorithms built into HP AutoRAID.
The HP AutoRAID ideal is RAID 1 random access performance at RAID 5 cost. This type of goal is common in hierarchic memory systems such as processor caches. To the extent that most data accesses can be resolved within the cache, the performance of the cache is experienced by the application. The performance of hierarchic RAID is based on the same logic.
In this paper we will explore the characteristics of hierarchic RAID and its effectiveness based on performance data sampled from production HP AutoRAID units in the field. In addition, appropriate responses to non-optimal HP AutoRAID performance will be discussed.
Nature of Hierarchic RAID
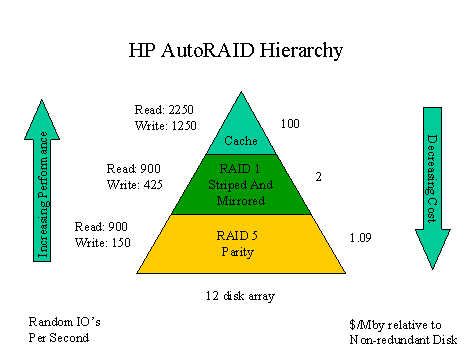
The performance experienced by any storage peripheral is the result of host workload characteristics, storage media characteristics, and the algorithms controlling the placement and movement of data. Three types of storage media are present in an HP AutoRAID array; RAM cache, RAID 1 managed disk storage, and RAID 5 managed disk storage.
RAM is much faster access, and much more expensive than disk storage. This makes RAM cache a good top layer of the HP AutoRAID storage hierarchy. Unfortunately RAM is so expensive that only a small fraction of the data normally accessed by field applications will be allowed to fit in it. Of course customers who can afford to put the majority of the data they access in RAM will get excellent performance.
All data stored in RAID 1 is duplicated on two different disk drives. In RAID 1 the disk space available must be twice as large as the capacity made available to the host for user data. In addition, all writes must go to 2 different disks. Reads, on the other hand, can be serviced by either disk. The RAID 1 space in an HP AutoRAID disk array is actually striped and mirrored, meaning that host data is spread in duplicate across all of the disks in the array as the array is filled. This has a tendency to balance work evenly across the disks while providing the protection of data redundancy.
The data stored in RAID 5 is sufficiently redundant to withstand the loss of one disk drive. This is done by storing parity information on one drive consisting of the "exclusive or" of the data on all of the other drives. In fact the drive used to store parity information is rotated through all of the drives to distribute work more evenly. The good news is that for RAID 5 only one disk worth of redundancy is required, making it less expensive than RAID 1. The bad news is that most writes to RAID 5, specifically random writes, must read the old data and parity information before writing the new. This is known as the "RAID 5 write penalty," since it causes a total of four disk IOís per host write. There is no penalty on RAID 5 reads.
A performance and cost summary is shown below in the form of a pyramid representing the HP AutoRAID memory hierarchy. The performance metric shown here is IOPs (I/Oís per second) which is an indication of maximum random data accessing capability. These figures are from measurements taken during factory benchmarking. While there are many ways of measuring performance this one is simple and sufficiently accurate for the purposes of this paper.

Throughout this paper the word "host" refers to the hardware and software that generates IOís that are serviced by the array. The word "workload" refers to a pattern of IOís defined in terms of opcodes (read or write), address, length and time between IOís.
It is very common in hierarchy management to place recently accessed data in upper layers of the hierarchy, while less recently accessed data is in lower layers. The idea is that data that was very recently accessed is very likely to be accessed again, and is therefore best kept in upper hierarchy levels. Data that has not been accessed recently is "aged" downward in the hierarchy. Since the performance of reads is very similar in both RAID 1 and RAID 5, only the last modify time is used to make aging decisions in HP AutoRAID.
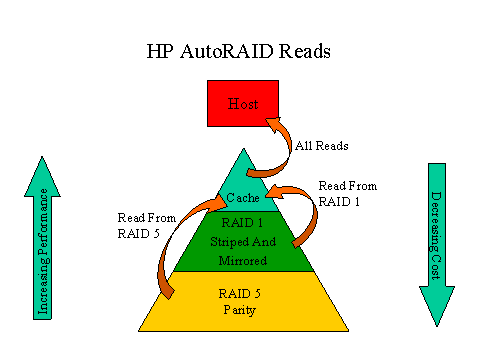
The following figure illustrates the use of the hierarchy during reads. Notice that all data flows through a read cache, and that it can originate from either RAID level. Data does not flow between RAID levels in response to reads. HP AutoRAID does employ a read ahead algorithm, the details of which are not a topic of this paper.
The next figure illustrates the motion of data during a write. Note that data once again always passes through the cache, and it can be automatically directed to either of the RAID levels. In addition an aging process moves data that has not been recently accessed downward in the hierarchy. Data that resides in RAID 1 usually remains in RAID 1 when it is rewritten. Data that resides in RAID 5 is often moved to RAID 1 as it is being written. This is the process that causes recently written data to reside in RAID 1, thus providing the basis for RAID 1 performance at the improved cost of RAID 5.
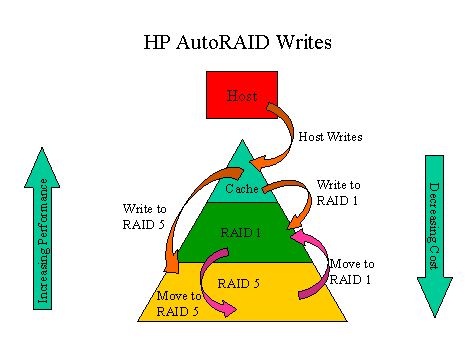
There are two conditions that can cause data to be written directly to RAID 5 in HP AutoRAID. If a high rate of sequential I/Oís is detected, then write data may be sent directly to RAID 5. This is done to take advantage of RAID 5ís "full stripe" mode in which enough data is accumulated to allow all of the data and the associated parity to be written at once. This avoids the "write penalty" described above.
The other condition that can cause direct writes to RAID 5 occurs when writes to data that are in RAID 5 occur very quickly. In that case, the movement of data to RAID 1 and the associated aging process would consume too much of the HP AutoRAID controllerís performance. As we shall see, this situation is rarely encountered outside of benchmarks, and can be remedied if it does occur.
What is Working Set ?
To further analyze the behavior of the HP AutoRAID hierarchy we will use the concept of a "working set." In HP AutoRAID the working set is the data that was written within a recent time interval. Data that is written multiple times during the interval does not add to the size of the working set. The time interval always ends at the time when the working set measurement is taken. Read data does not contribute to the working set in HP AutoRAID. For this reason the working set in HP AutoRAID is often referred to as the "write working set."
In classical hierarchy management, the concept of working set is applied to reads as well as writes, and it does not always involve a specified time interval. Inclusion of the time interval makes HP AutoRAIDís working set more flexible, as the time interval can be adjusted to a value that is relevant to the performance of a given application. Often during benchmarks the working set interval is taken to be the entire duration of the benchmark.
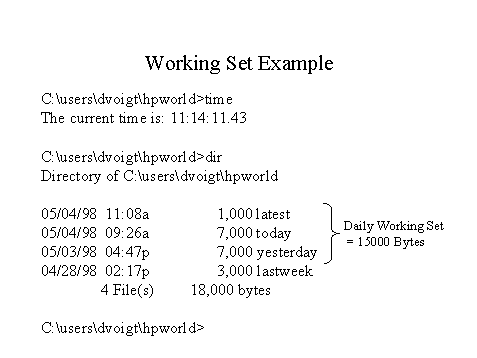
One easy way to illustrate the working set is to consider the file modify times in a typical directory listing. This file system example is for illustration only. Since HP AutoRAID is a SCSI peripheral it monitors working set at the disk block level ( actually in 64K chunks) rather than the file system level.
The following directory listing contains file sizes and modify times. If the working set interval is 1 hour at the time when this directory was listed, then the working set would consist only of the first file listed. If it were one day, then it would include the first three files. Since this working set definition is based on recency, it does not matter how often the file was written, only when it was last written. HP AutoRAID was designed to operate optimally when the daily (24 hour) working set fits in RAID 1. This time was chosen to be large enough to accommodate daily access patterns without repeatedly moving data around in the hierarchy. The working set interval used for all of the measurements in this paper was 1 day.
Importance of Working Set in Hierarchy Management
Let us now combine the concepts of working set and movement in the HP AutoRAID memory hierarchy. Our analysis will be broken into three cases. One is when the working set is constantly in RAID 1. A second is when the working set size is less than the capacity of RAID 1, but its content is changing. A third is when the working set content is not changing, but it does not fit in RAID 1.
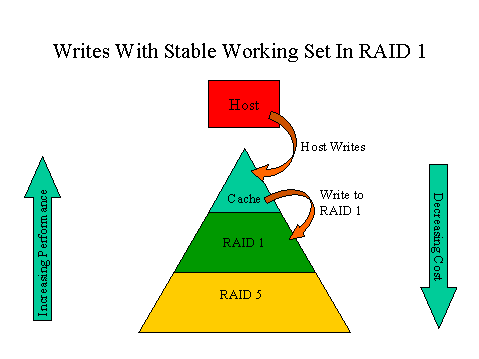
The following figure illustrates the behavior of HP AutoRAID writes when the working set is contained completely in RAID 1. In this case data is accumulated in non-volatile RAM until writing to RAID 1 is triggered by a combination of time and freespace criteria. Data is never written to RAID 5, and data does not move from RAID 5 to RAID 1. In this mode of operation the host experiences primarily the performance of RAID 1.
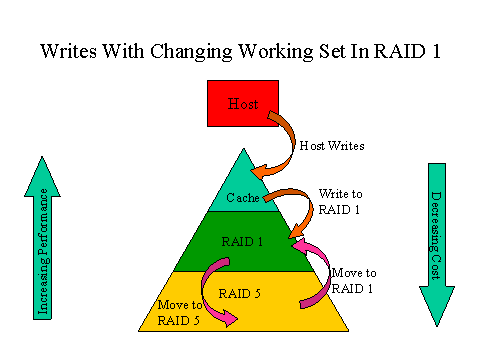
The next figure shows what happens when the working set fits in RAID 1, but its content is changing. For example, the working sets on two consecutive days may be the same size even though they have different blocks in them. In this case data that was in RAID 5 when it was written is usually moved to RAID 1 as illustrated by the "Move to RAID 1" arrow. This movement is necessary in order to cause data that has just entered the working set to be stored in RAID 1. At the same time the complementary process of aging moves the least recently written data in RAID 1 down to RAID 5 in order to make room for new working set contents.
The last case is when the working set does not fit in RAID 1. In this case the motion of data between RAID 1 and RAID 5 may not contribute to performance. In fact, depending on the amount of overage it could detract from the total performance of the subsystem. The movement of data from RAID 5 to RAID 1 is limited to 64K of data at a time. In fact if the workload is too intense then the motion of data between RAID 5 and RAID 1 is suspended. These provisions are designed to avoid thrashing of data between RAID 1 and RAID 5 to the detriment of the performance experienced by the host.
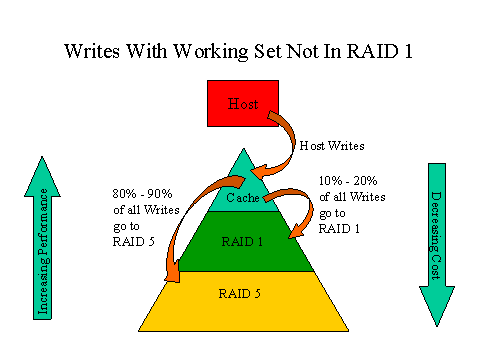
As illustrated above the connection between working set and HP AutoRAID performance is dramatic. Write performance can degrade from RAID 1 performance to RAID 5 performance if the working set is too large. This is why it is important to understand working set characteristics in the field.
Statistics Gathering Process
Every HP AutoRAID disk array contains a performance log page which continuously records daily working set, and the motion of data between RAID 1 and RAID 5 along with a number of other performance characteristics. The HP AutoRAID manager utility includes a process that reads the performance page every 15 minutes and records it in a log. Using the Array Manager utility this information can be reviewed in the field along with suggestions for improving performance.
Samples of this same information have been non-intrusively packaged and returned to the factory. Performance data obtained by this method from willing customers was recently analyzed to produce the information in this report.
Observations
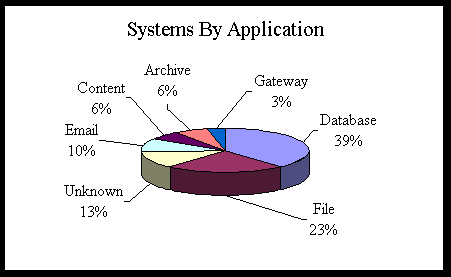
The data gathered so far includes 142 HP AutoRAID disk arrays from 40 different systems. Included with the data is a report from the system manager indicating the application. A number of systems were indicated to be running benchmarks, or not yet configured. These non-production systems were removed from the data set. The breakdown of production systems by application is represented by the following pie chart.
Working Set Data
The primary characteristic studied was the working set size in proportion to the total capacity of the array. The data are generally presented as a histogram of working set size as a percentage of total array capacity across the 31 systems remaining in the sample after the non-production systems were removed. Analyzed in this manner the data appears as follows.
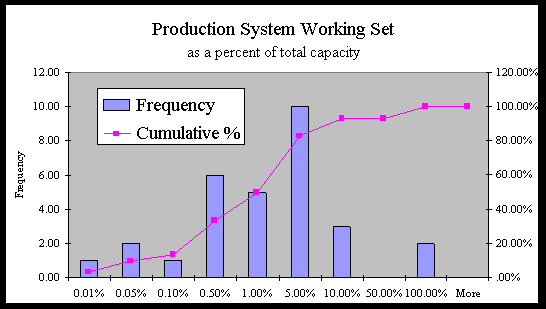
The key information in this chart is represented by the three tall bars in the middle of the graph. These bars indicate that most of the systems sampled had working sets that consumed between .1% and 5% of available capacity. HPAutoRAID always reserves at least 10% of its available capacity for RAID 1 space. This graph indicates that the working set sizes of most of the systems sampled are within the range that HPAutoRAID was designed to accommodate.
Lets look more closely at the graph. The X axis indicates a percentage of total capacity. Each bar represents some number of systems whose working sets fall into a range of percentages of the total. The range for each bar is all of the percentages greater than the label on the bar to its left, and less than or equal to the label on that bar. The Y axis on the left measures the height of the bars, each representing the number of systems in that range.
The line through this graph represents the cumulative percentage of the systems that fall at or below the working set size indicated on the X axis. The percentages on the right hand Y axis correspond with this line. When the cumulative line reaches the right side of the graph it must be at 100%.
For example, examination of the 5% bar shows that 10 systems had working set sizes between 1% and 5% of the total capacity in the array. Furthermore, the cumulative line moves from 50% to 90% at this bar. 50% of the systems have working set sizes less than 1%, while 90% have working sets less than 5%.
We can also observe that only 13% of the systems had working sets less than .1%. This observation is relevant to the sizes of cache RAM and the use of the RAID hierarchy. A cache of .1% of the capacity of a 100 Gigabyte disk array would be 100 Megabytes. This cache would contain the working set of less than 20% of the systems we sampled. On the other hand , an amount of RAID 1 storage equal to 10% of the total capacity would contain the entire working set on 93% of the systems sampled.
Of course completely containing the working set would yield a 100% hit rate. The hit rate declines as the amount of working set data that does not fit in the cache increases. The rate of the decrease in hit rate depends on the frequency of access to data blocks. The actual performance advantage of the hierarchy depends on these factors, plus the relative access times of the hierarchy levels, and various aspects of the caching algorithm.
What happens to performance if we exchange RAM cache for RAID 1 storage while holding cost constant? For the price of 1Mby of RAM one can purchase 50 Mby of RAID 1 space. This means that in the best case the entire working set of a system might fit in RAID 1 when only 2% of it would fit in a RAM cache that had the same cost. We now use the performance figures from earlier in this report in a cache hit rate calculation. The performance of a RAID 5 array with a cache that contains 2% of the working set under a random workload is (.02 * 1250 IOPs) + (.98 * 150 IOPS) or 172 IOPs. The random workload performance of an HP AutoRAID array with its working set entirely in RAID 1 is 400 IOPs, an improvement of over 130% with no increase in cost.
Working Set Versus RAID 1
Are the working sets of the systems sampled fitting in RAID 1? This can be determined by observing a histogram of the ratio of working set to RAID 1. When this quantity reaches 100%, RAID 1 is precisely
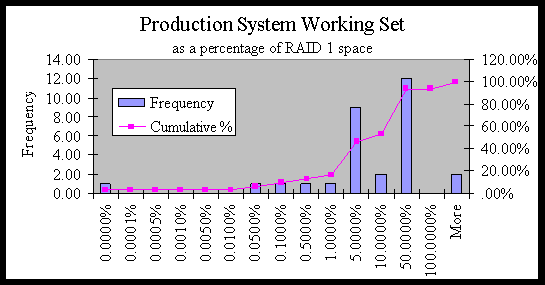 filled by the working set. The following figure illustrates this information.
This figure indicates that only 2 of the systems sampled had average working sets that failed to fit in RAID 1. 46% of the systems used less than 10% of the RAID 1 space, and 93% fit in RAID 1. This indicates that most customers are getting the benefit of RAID 1 performance.
What about the systems whose working set do not fit in RAID 1? Customers can monitor working set size in the field using the same array monitor utility used to gather this data. If this utility indicates that the working set does not fit in RAID 1, customers have the option of adding disk space on line. When space is added that is not consumed by newly created LUNs, the HP AutoRAID array will use it to expand RAID 1 size. As a result a larger working set will fit in RAID 1. Of course as storage is added with no increase in total LUN capacity, the cost of the system approaches that of RAID 1, rather than RAID 5. The fact that HP AutoRAID LUNs are not associated with particular disks, allows more dynamic use of disk storage.
With this in mind, customers may wish to leave some unfilled slots in HP AutoRAID arrays when they are purchased. Once production working set size can be measured, informed decisions can be made about the installation of additional disk capacity, and its subsequent use for adding LUNís. If the array is fully loaded and the working set does not fit in RAID 1, customers have the option of offloading LUNs onto additional disk arrays.
Working Set By Application
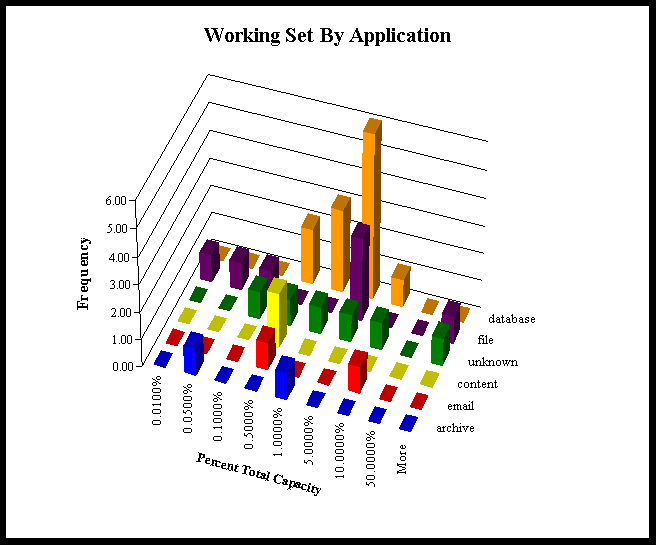
Finally, the following figure illustrates how different application types working set sizes are distributed. Notice how the databases are most tightly clustered clustered in the 1% to 5% range. The other system types are flatter, with one file system and one system of unknown type having the largest working set percentages. Further analysis of systems by application type probably should be deferred until additional data is available.
Conclusions
HP AutoRAID performance is best when the applicationís daily working set fits in RAID 1. This does not mean that RAID 5 storage cannot be used. All but 2 of the 31 systems sampled in a recent field performance data survey had working sets that fit in RAID 1 even though most were configured to include some RAID 5 capacity. Hierarchy management is HP AutoRAIDís way of achieving the ideal of RAID 1 performance with RAID 5 capacity.
The RAID 1 level of the HP AutoRAID hierarchy is so much bigger than the RAM cache that many applicationís working sets fit completely in RAID 1, yielding a very high hit rate. The use of RAID 1 storage to reduce the size of RAM cache can yield over 100% performance improvement with no increase in cost.
While working set behavior varied somewhat across applications, instances where working set did not fit in RAID 1 occurred only in a file server and in one unknown application. The majority of systems had working sets that fit in RAID 1 regardless of application. Ongoing data gathering may allow more statistically significant information, especially when systems are broken down into applications.
Even for systems with working sets that did not fit in RAID 1, HP AutoRAID uses the space freed by addition of disks or movement of LUNs to increase RAID 1 size. This allows the working set to once again fit in RAID 1.
In short, evidence from the field does indicate that the benefits of hierarchic RAID are being experienced by most HP AutoRAID customers. In addition, HP AutoRAIDís unique flexibility offers a remedy for those applications that experience performance problems due to large working sets.