
At the heart of every business centric strategy is application management. Applications reflect the user perspective of what is being accomplished in the distributed computing environment and therefore they are the greatest link between users, the business, and the computing services that are being provided.
When working with customers and other HP professionals, we often find that there is confusion about the right technology to use for application monitoring. Should application transactions be monitored with the Application Response Measurement (ARM) or is an overall summary of application performance more appropriate? What are the advantages and disadvantages of using OpenView Smart Plug Ins for managing commercial applications such as Baan, SAP, etc.? How can MIB information from practically anywhere be brought into HP OpenView?
Users certainly have many choices to monitor applications. It is our intent to introduce several options here and let you select the one that meets your needs best based upon your own application environment.
Viewing Application Measurements
If you are an OpenView user, you probably have one or more management consoles to view your computing environment from a central location. Perhaps you have IT Operations (ITO) to receive service management events. If you do have ITO, alarms from an application will come into the message browser. From the message browser, many alarm events can be resolved with an automatic action.
Some application events are not easily resolved. These are the events that need to be viewed in the context of the service that is being provided. Using HP IT Service Manager, if an application is not performing correctly, what services are impacted? Are there processes in place to report and resolve the impacted service? What is the resolution to a service event? These are just a few of the issues that IT Service Manager can help manage.
Applications events can also require detailed analysis using PerfView. PerfView provides a single pane of glass to view application information along with other elements in the IT environment including resource measurements from the operating system, database, and network. Measurements from various computing elements can be viewed together because PerfView receives information from MeasureWare agents.
The MeasureWare agent acts as a repository for measurement in the distributed computing environment. It time-stamps, summarizes, stores, and optionally alarms on those measurements. Application information stored in MeasureWare and displayed in PerfView will be one of the primary technologies highlighted in the remainder of this technical brief.
Option One - User Defined Applications
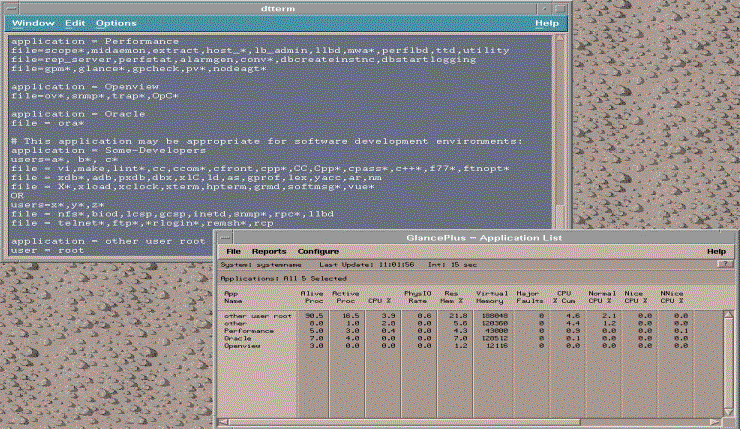
Both MeasureWare and GlancePlus allow users to group application processes together to reflect business processes, functional groups, and/or individual resource users. For instance, grouped together in the application section of the parameter file may be processes associated with all individuals in the Finance department, and/or perhaps all processes associated with the running of the general ledger application.
Once processes are grouped together, application information may be displayed in either GlacePlus from a system only/real time view, or from PerfView with its enterprise historical perspective. Using these solutions, the resource analyst is able to get a detailed picture of how business processes, functional workgroups, and/or individual resource users are utilizing system resources. Resource hogs are quickly identified. Changes in resource utilization are also recognized when business processes change, or new programs are added.
Using application process grouping, excessive or minimal resource consumption by an individual or group of users can be tracked. It is possible to use this information for billing purposes or to trigger alarms based on application thresholds.
Logging application data is very powerful and easy to implement in both GlancePlus and MeasureWare. There is no requirement to instrument source code. The only requirement is to have knowledge of how users, groups, and processes should be grouped to provide meaningful business information.
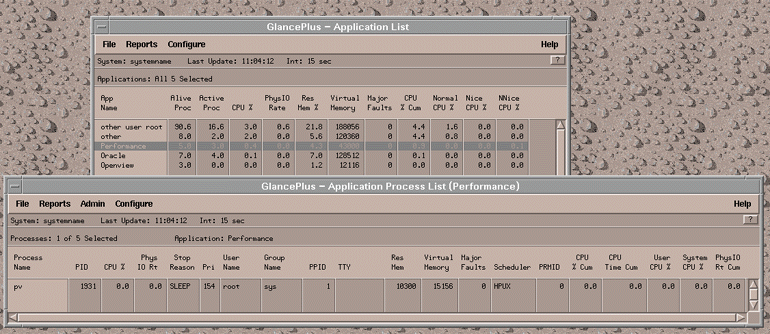
The following graphics shows a sample parameter file designed to provide information on the performance of an entire system as well as resources being consumed by distinct groups of processes and/or users. The applications configured in the file are displayed in GlancePlus. The second graphic shows how GlancePlus can be used to drill down to the actual process that are running in the application groups.

Option Two - OpenView Smart PlugIns
An emerging technology for application management within HP OpenView is the new SMART Plug-Ins for both applications and databases. These monitors are being introduced in 1998 for specific commercial databases and applications such as Oracle, Informix, SAP, Baan, etc.
The SMART Plug-Ins (SPIs) collect event and measurement data and feed the data into OpenView IT Operations and MeasureWare/PerfView where the information is tightly integrated and managed. IT/Operations provides the interface for events and PerfView provides the ability to do analysis with other computing elements such as the OS information collected by MeasureWare or network information from NetMetrix.
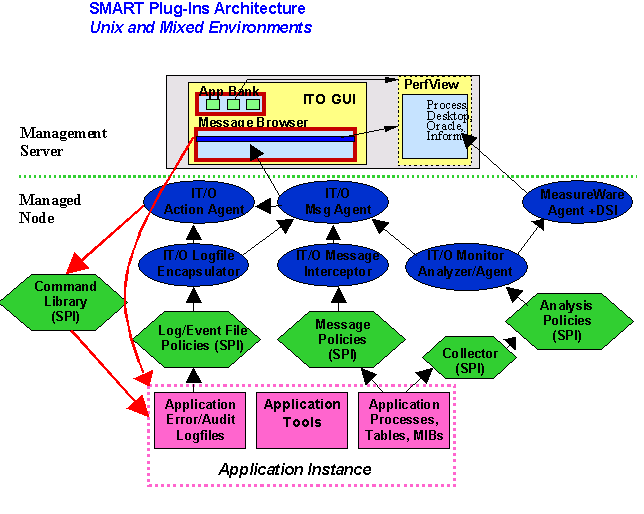
SMART Plug-Ins are intended to be out-of-box solutions. The plug-ins are mass-deployed from IT/Operations. Measurements from the application can be monitored with predefined collection, thresholds, and actions. A big advantage to using the plug-ins from HP is that users do not need to become experts on each application's metrics. The SMART Plug-Ins are predefined for each application based on expert input as to what are the most important metrics, thresholds, and corrective actions. Users will also appreciate that SMART Plug-Ins are maintained, updated, and supported by HP as each new release of an application occurs.
SMART Plug-In for SAP R/3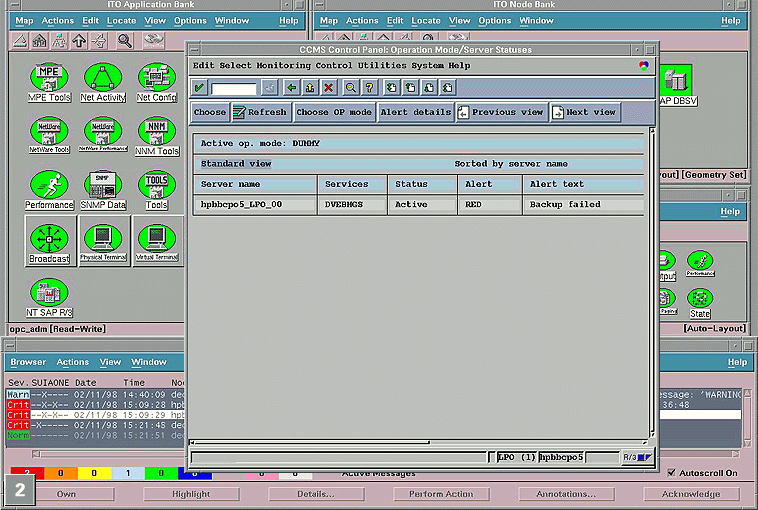
Option Three - Other Commercial Monitors
Other commercial monitors do exist outside of HP SMART Plug-Ins. While HP would like to believe that every customer wants to purchase only HP products, certain situations exist that make the integration of another vendor's product a requirement. For instance, a customer may already have an application monitor from another vendor prior to the purchase of HP OpenView solutions.
HP OpenView continues to be an open solution. OpenView partners whom have similar products to the application plug-ins can integrate with OpenView. For instance, IT/Operations has the ability to receive events from several commercially available application monitors. If desired, application information can still be analyzed in PerfView along with database, system, and network data.
To view data in PerfView from commercial monitors that are not from HP, there is a little extra work required. First, unlike the HP SMART Plug-Ins, non-HP commercial monitors do not automatically feed application and database information into the MeasureWare agent. Fortunately the MeasureWare agent has an open technology and it can receive data from these monitors using either its built in Data Source Integration capability or the new Custom Solution Builder. Both these technologies are discussed later in this paper.
Option Four - ManageX Snap-In’s and Policies
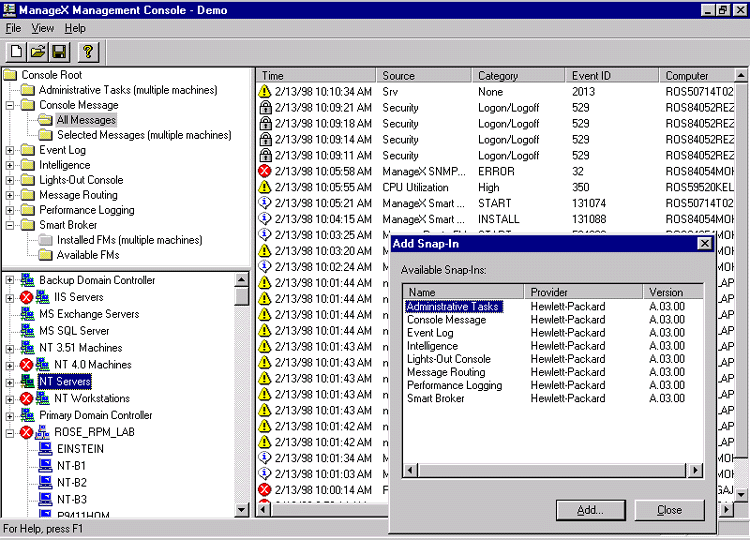
The newest addition to HP OpenView is ManageX, a solution initially focused on managing Windows NT and Microsoft BackOffice environments. For application management, ManageX has eight snap-in functional units. In the future, Openview or third party vendors may create additional Snap-Ins for specific user needs. The current functional units "snap-in" to the MMC (Microsoft Management Console), providing the ability to perform tasks such as managing policies or performing administrative functions.
ManageX’s policies are a set of specifications that help automate administration. Several policies are delivered with the ManageX product which can be used as is, or customized to meet specific requirements. Using pre-defined policies, key application indicators are monitored such as MTA queue lengths, log file sizes, user connections, and run-away processes. When the health of an application is impaired, automated corrective actions can occur without manual intervention of a local administrator.
Manage X snap-in policies exist for some of the more popular applications including:
Windows NT
Microsoft SQL Server
Microsoft Exchange Server
Microsoft Internet Information Server
Option Five - Data Source Integration (DSI)
Built into MeasureWare is the Data Source Integration (DSI) technology. DSI allows MeasureWare to accept data from almost any data source including application measurements or other application information. For instance, an order processing application may have already built in a measurement to track "average call time". This measurement can be accepted into MeasureWare where it is time stamped, stored, summarized, and optionally alarmed upon. PerfView will display the "average call time" along with other measurements from the enterprise to get an accurate picture of this application process in relationship to other elements in the enterprise.
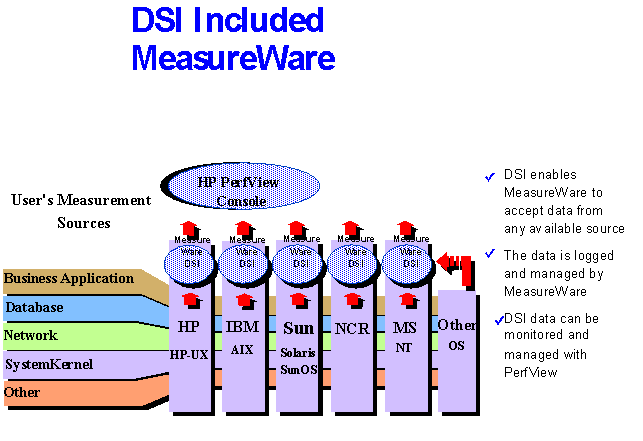
It should be noted, once data has been integrated into MeasureWare, it is indistinguishable from any other data in the MeasureWare repository. It also is displayed in PerfView exactly the same as other data collected native to MeasureWare.
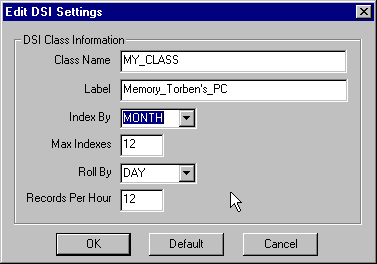
DSI is easy to implement. First a class specification file is built. This specification file defines the characteristics of the data, including its definition, frequency of collection, and storage requirements. The class specification file is then compiled, and stored on the server with the MeasureWare agent. The processes are then built to collect the data and pass it to the MeasureWare DSI logging agent. This data may be passed through a flat ASCII file, passed through a pipe (|), or through a named pipe (fifo) to the DSI logging process (dsilog). The dsilog process then timestamps the data, and writes the data into the log file.
Once in the log file, this data is acted upon just as any other MeasureWare data. As already described, the data can be viewed in PerfView. It also can be passed on to other tools such as SAS, or Excel. The data can also be used by MeasureWare to provide service management alarms that are passed on to ITO.
Steps in creating a DSI data feed:
(1) Create the Class Specification File.
(2) Compile the Class Specification File.
(3) Start the DSILOG Logging Process.
(4) Register the Data Source.
(5) Define Alarms based on Your Data.
(6) Customize Graphs with DSI data in HP PerfView
The capability to use measurements from almost any data source and alarm on those measurements, in a service management context, is extremely flexible. A creative example of this flexibility was demonstrated by an engineer who decided to test DSI by importing outside temperatures from a weather internet site. Once in MeasureWare, the temperatures were successfully time stamped, stored, and summarized with OS, database, and network measurements. The end result of this experiment is that if so desired, an alarm could have been sent to ITO when the wait queue is greater than 5 and the outside temperature is above 90 degrees Fahrenheit.
Unlike our temperature example, there are several scenarios where DSI is particularly useful. Examples of data being brought into MeasureWare for use in OpenView include:
Importing system measurements from platforms that a native MeasureWare agent does not exist on. For instance CPU, disk, and memory from SCO/Unix/Ware.
Bringing in performance measurements from database tables. Prior to OpenView SMART Plug-Ins, this was the primary way to bring database information into the OpenView management environment. DSI is still an underlying technology in the SMART Plug-Ins, however the configuration work that normally would be required is already imbedded into the product.
Feeding in SAS CPE or spreadsheet statistical data so that it can be viewed in PerfView alongside computing performance measurements.
Using DSI, the data that can be integrated into MeasureWare, is virtually limitless. It is sometimes tempting to push as many measurements into MeasureWare as can be collected and retrieved, however this is a tactic that we discourage. The simple criteria we recommend is that imported data should be useful. The data measurements should warrant correlation either by themselves or with other collected measurements from the computing environment.
Option Six - Custom Solution Builder (CSB)
Many applications and middleware store information in SNMP MIBS. This information can be input into MeasureWare using the Custom Solution Builder (CSB). Sold separately from MeasureWare, the Custom Solution Builder is a developer’s kit that takes advantage underlying DSI technology.
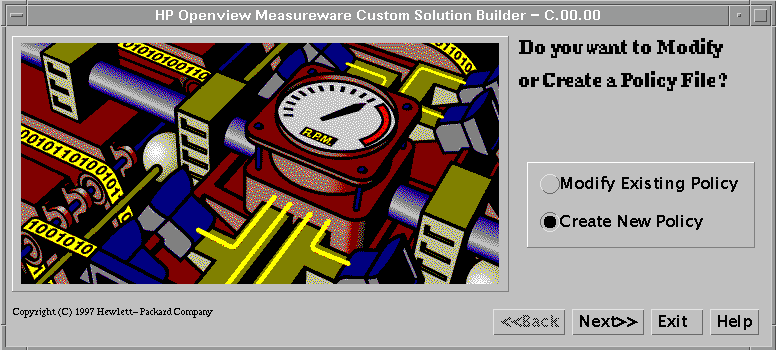
Unlike DSI, the developer does not need to build and compile a specification file defining DSI data. With CSB, values from MIB trees that contain resource and performance management are selected and translated into MeasureWare with a simple point-and-click GUI. This simplified process allows users to integrate meaningful metrics from middleware environments including databases and applications.
Despite its easy to use interface, this tool is not for everyone. It should only be considered for users who have experience with the MIB structures and in particular, the MIB that is being worked with.
Once CSB has the data integrated into MeasureWare, it can be used in a variety of ways. The data can be viewed in PerfView, or alarmed on and sent to ITO. It also can be extracted and exported into ASCII, binary, or spreadsheet format, or left in its native proprietary format.
It should be noted, SMART Plug-Ins are still the preferred way to retrieve much of this data, however the CSB is useful when a supported commercial monitor does not exist and the user must resort to bringing in the data by herself.
Option Seven - Extended Collection Builder (ECB)
Windows NT introduced the concept of a flexible, extensible registry of performance objects, instances, and counters. This structure does not exist in traditional Unix platforms. For example, the installation of a Microsoft Backoffice application also installs performance measurements in the form of extensible counters. They contain a wealth of information regarding the performance of specific NT applications such as MicroSoft Exchange.
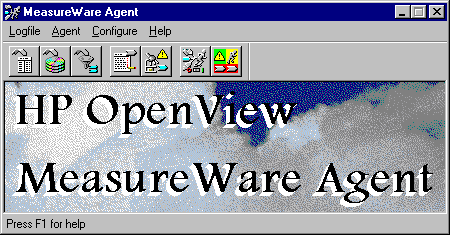
To bring this information into MeasureWare, DSI is again used as an underlying technology. Recently released as part of MeasureWare NT, at no extra cost, is the Extended Collection Builder (ECB). It is a sub-agent that allows for any performance object, instance, or counter from the Windows NT to be logged into MeasureWare, displayed into PerfView, and optionally alarmed on and sent to IT Operations Center and managed in IT Service Manager.
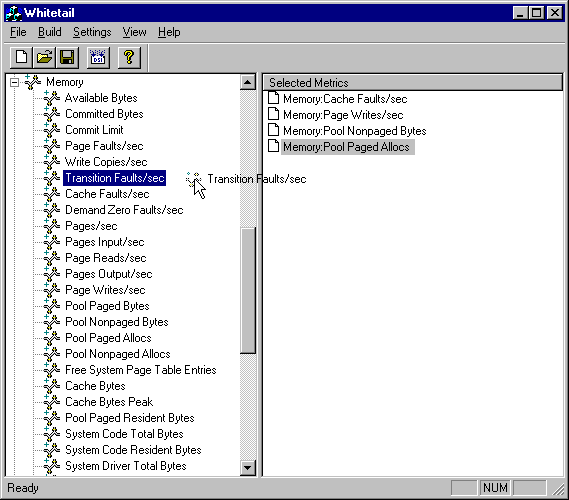
ECB allows users to quickly access the Windows NT resource and performance information. After a collection has been defined, users can easily start and stop the collections using a drag and drop interface. When collection is started, data is sent to the MeasureWare Agent at regular intervals.
Extended Collection Builder for all performance counters available in the NT registry
While ECB enhances the capabilities of OpenView users to manage critical services provided by BackOffice, Web Servers, and other NT applications, it should be noted that HP OpenView is also coming out with many SMART Plug-Ins specifically for some of the more popular NT applications. The SMART Plug-Ins will have an advantage over ECB because in addition to the monitoring capabilities of an ECB built monitor, these SMART Plug-Ins will have pre-configured thresholds, and corrective actions. Finally the SMART Plug-Ins will be built and supported by HP and updated when an application changes its internal characteristics.
Option Eight - Application Response Measurement (ARM)
Hewlett-Packard and IBM/Tivoli have jointly developed a standard for measuring application transactions with input from other vendors and customers. The Application Response Measurement (ARM) is a set of standardized calls available to customers, application providers, application tool vendors, and system management vendors. In OpenView, it is included as part of the MeasureWare agent.
Application code is instrumented with ARM calls (see following table for list of calls) to identify where a transaction starts and ends. MeasureWare then treats the ARM information like any other data. It timestamps, stores, and alarms on the ARM service level measurements. ARM is the ONLY way to measure and monitor at the business transaction level, a critical ingredient for supporting service level agreements.
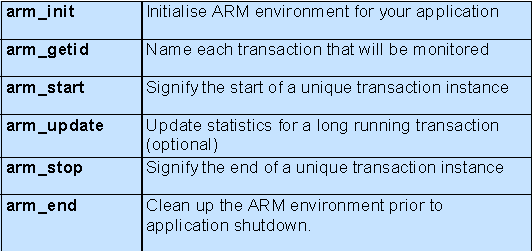
The process for ARMing an application is very straight forward. ARM calls are inserted into the code to define important business transactions, and the code is compiled. When the code is run, statistics on the defined transactions are collected. These statistics are then managed like any other MeasureWare data.
There are situations where it is not feasible to instrument application code. For instance, applications that are built by software vendors rather than in-house, or those applications that are considered functionally complete. One approach is to instrument a script created by a remote terminal emulator (RTE) package. RTEs have the ability to generate a script by recording the real dialogue between a user terminal or workstation and the application/database servers. Once recorded, these scripts can be edited with ARM API calls.
Even though HP and IBM are using the same ARM standard, they are still competitors. OpenView will manage and display ARM data differently from Tivoli. Here are some of the ways OpenView uses ARM to provide a better look at a business transaction within the computing environment. For example:
Frequency of transactions within an interval - there were 358 Transaction XYZs in a five minute period.
Distribution of transactions - in the five minute period,20 Transaction XYZs had an average response time from 0.0 to 0.5,150 Transaction XYZs had an average response time from 0.5 to 1.0, etc.
Average transaction response time - the average response time for XYZ was 1.3 seconds over a 10 minute period.
Correlation of enterprise data - display in PerfView the average transaction response time over a given period while also displaying operating system, database, and network data.
Service management alarming - send an alarm to ITO when the Transaction XYZ is taking longer than two seconds to process over a five minute period.
Each transaction can be labeled from an end-user perspective. While some application developers will still want to label transactions with strings of alpha and numeric characters, the trend should be to create transaction names that are meaningful to end users. For instance, instead of labeling a transaction "UDT23", why not label it "inventory update", "new subscriber", etc.
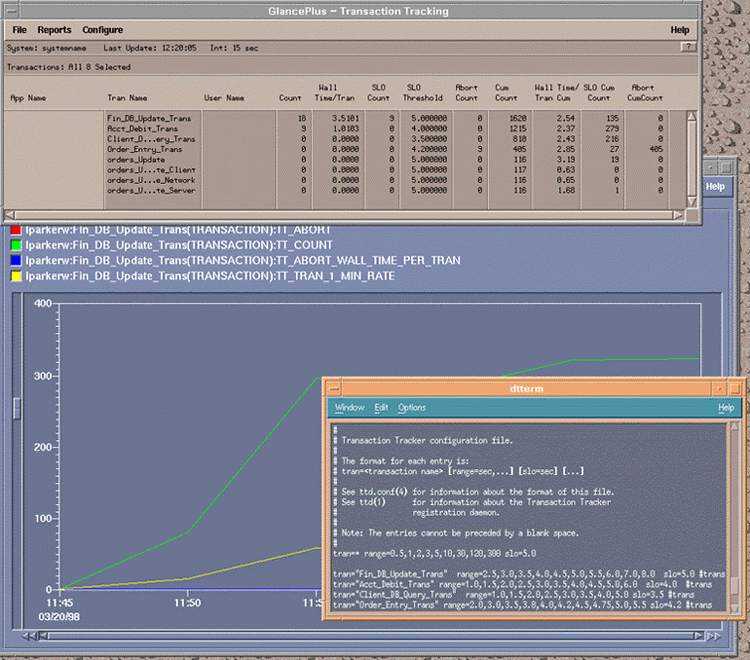
The following graphic shows business transactions being monitored ‘real-time’ by GlancePlus, as well as historical trending of these transactions with PerfView Analyzer. The inset display also shows the contents of the ‘ttd’ file, this file is used to define Service Level information.
Concluding Remarks
It is crucial for the IT department to deliver to the service levels required by the business units. This can only be done if measurements are taken on the behavior of the services provided to the business unit. Application monitoring is the only way to collect these measurements.
HP OpenView offers many options for retrieving, storing, and integrating application measurements. Each option must be evaluated and incorporated based upon the requirements of the service level agreement as well as the flexibility of the technology gathering information from the application.
Once the level of service being delivering to the end-users is understood processes can be put in place to either maintain or improve that service. If the business unit’s operational performance is being affected by the IT department it will not be long before that business unit starts to look for another service provider.