
Application Management Return on Investment
for ERP Applications
Section 1. Introduction to the Return on Investment (ROI) Methodology
What are the benefits of ERP?
Enterprise Resource Planning (ERP) software is being implemented by more and more organizations that are seeking comprehensive business and information management tools. ERP applications comprise specific modules that streamline critical business functions: financials, human resources, materials management, sales and distribution, warehouse management and more.
Organizations realize important benefits from implementing ERP software such as:
What are the challenges of ERP?
The benefits of ERP come at a price. ERP applications require extensive planning, including structural reorganization and process change in many cases. They require a commitment from all departments. Most organizations implementing ERP use third-party help for installation and training to reduce the risk and time to implementation. Once the ERP software is in place, the IT organization faces new and complex application management issues.
What solutions are available?
Tools do exist that can ease the implementation and help manage the production ERP system. Some are built into the application itself, like the CCMS tool from SAP for R/3. Others are third-party tools that can assist administrators with the volume of work associated with managing the vast ERP environment. But some application management software products can integrate with every component of the ERP system to augment tools inherent in the application and monitor and manage each part of the environment, no matter how diverse - and all from a single console!
The ROI spreadsheet tool
Application management tools are designed to increase availability and optimize performance for the entire system. These tools should fully integrate with all of the applications, databases, operating systems and underlying technologies. While the IT manager or CIO may not readily see how spending even more money on the ERP application will be cost-justified, the ROI spreadsheet tool is designed to clearly illustrate the return on investment for application management tools.
Show me the money!
We have researched examples that can prove using a robust management tool for ERP environments can save the organization money; and not just after the project has "gone live." Significant cost benefits have been realized by organizations that have used applications management tools early in the implementation cycle, including reduced downtime, more efficient use of staff, and shorter implementation times.
The ROI spreadsheet tool will assist companies in deciding if acquiring and implementing application management tools is a good investment for their ERP application. The spreadsheet provides an easy-to-read method for calculating the ROI for the application management tools, using each company’s own specific assumption figures. It will calculate the net present value (NPV) of the total cost of ownership, including implementation and training, and the NPV of the savings that will be realized over the implementation and a two year production period.
The questionnaire
To determine the best advantages for your particular situation, it is beneficial to use the questionnaire on the next page. The questionnaire was designed to make the ROI spreadsheet tool even easier to use. Items from the questionnaire can be entered into the spreadsheet to determine financial impact.
The Questionnaire
Please answer each question. If you do not know an exact answer, give your best estimate. These numbers will be used to determine your financial analysis for the ROI spreadsheet tool.
How many months would you like to consider in your evaluation? ___________________________
[Note: the recommended duration is 36 months or less.]
What is the cost of capital you plan to use in this evaluation? _______________________________
What is your estimated cost per hour for your business downtime? ___________________________
What percentage do you estimate your business downtime costs will increase annually? __________
How many operating system failures do you anticipate per month on production servers? _________
How long, in hours, does it take you to recover from one operating system failure? ______________
How many database failures do you anticipate per month on production applications? ____________
How long, in hours, does it take you to recover from one database failure? _____________________
How many application failures do you anticipate per month on production applications? ___________
How long, in hours, does it take you to recover the application from a failure? ___________________
ERP STAFF COSTS:
What is the compensation per hour for your partner/VP?
Compensation per hour ____________ Number of them ____________
What is the compensation per hour for your new ERP consultants (<1 year experience)?
Compensation per hour ____________ Number of them ____________
What is the compensation per hour for your experienced ERP consultants (1-4 years experience)?
Compensation per hour ____________ Number of them ____________
What is the compensation per hour for your senior ERP consultants (>4 years experience)?
Compensation per hour ____________ Number of them ____________
What is the compensation per hour for your ERP managers?
Compensation per hour ____________ Number of them ____________
What is the compensation per hour for your ERP program directors?
Compensation per hour ____________ Number of them ____________
What is the compensation per hour for your ERP specialists?
Compensation per hour ____________ Number of them ____________
What is the compensation per hour for your ERP-dedicated system administrators?
Compensation per hour ____________ Number of them ____________
What is the compensation per hour for your ERP-dedicated database administrators?
Compensation per hour ____________ Number of them ____________
What is the compensation per hour for your ERP-dedicated LAN administrators?
Compensation per hour ____________ Number of them ____________
What is the compensation per hour for your ERP-dedicated application developers?
Compensation per hour ____________ Number of them ____________
What is the compensation per hour for your ERP-dedicated application administrators?
Compensation per hour ____________ Number of them ____________
What is the compensation per hour for your ERP-dedicated business project team?
Compensation per hour ____________ Number of them ____________
How to navigate the spreadsheet: The tabs at the bottom of the screen denote different sheets. Please enter the appropriate numbers on each sheet. These default numbers represent a composite of several customer cases. Enter your own numbers into all white cells. Gray cells are "locked" or calculation cells. If you click on "?" you will see information about that cell to help you estimate your numbers, if needed. If you want to go directly to the summary, click on the tab marked "TCO Summary," which shows the final ROI. At the bottom of each sheet are Forward [>>>] and Backward [<<<] buttons which will allow you to navigate through the tool step-by-step.
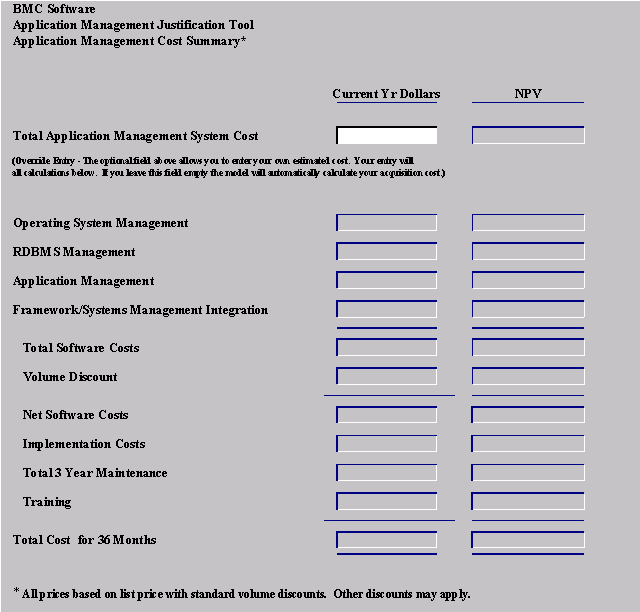
Sheet 1: Application Management Cost Summary
This sheet summarizes the Application Management products costs, based on the number of products and licenses. It will automatically calculate totals.

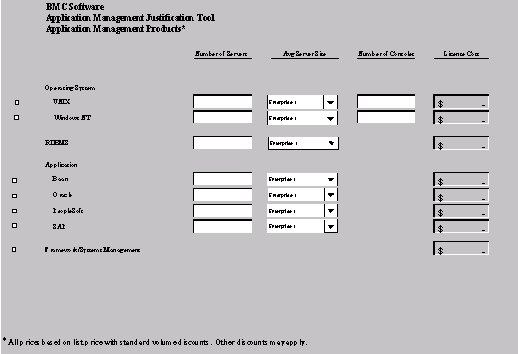
Sheet 2: Products
Fill out this sheet based on the products in each category. If a product category does not apply, leave it blank. The drop-down arrows are for designating the size and type of server. The "cost" column at the right automatically calculates costs based on the answers given in the other cells of the spreadsheet.
Sheet 3: General and Resources
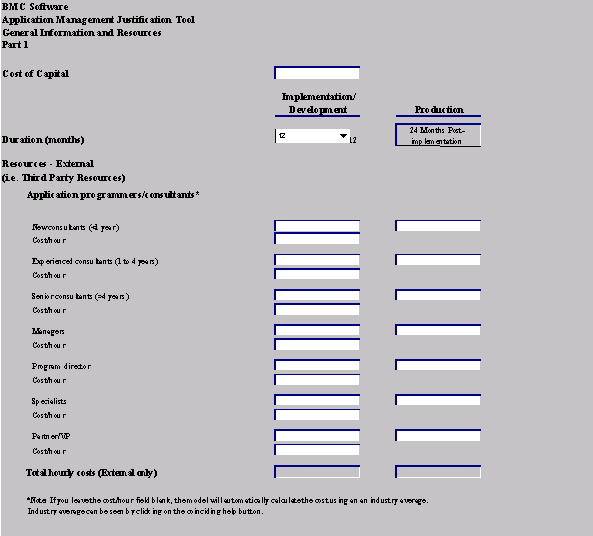
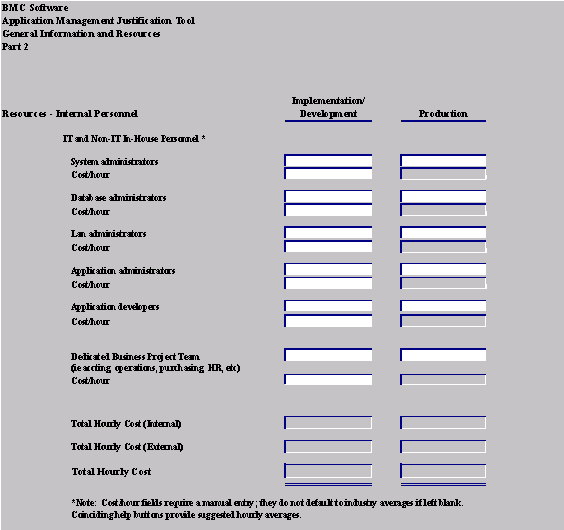
This sheet pertains to staffing costs for the implementing company, both in-house and contracted personnel. If some positions listed do not apply, enter a "0" in the corresponding cell. Enter the expected months for implementation and development on the top row. The production time is fixed at 24 months for evaluation purposes (the recommended time). It starts when the system goes into production.
Part I: External Resources:
Part II: Internal Resources:
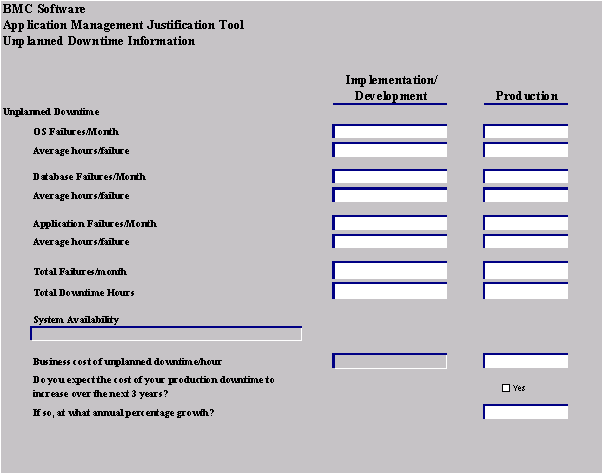
Sheet 4: Unplanned Downtime
This sheet assists in the calculation of the cost of unplanned downtime. Either actual downtime hours or a percentage of system availability may be entered.
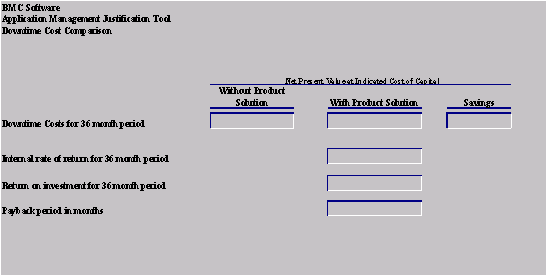
Sheet 5: TCO Summary
This sheet provides the "bottom line" figure that summarizes the return on investment for the application management product. It is the most important sheet because it calculates the unplanned downtime costs that will be saved.
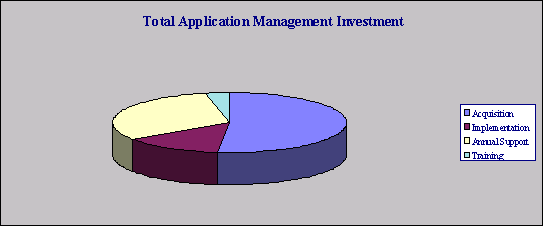
Sheet 6: Graphs to illustrate cost sheets
The spreadsheet ROI tool also provides graphs showing results, such as cost comparisons with and without application management products, based on the input from the spreadsheet. This graph shows the relative cost of application management tool ownership:
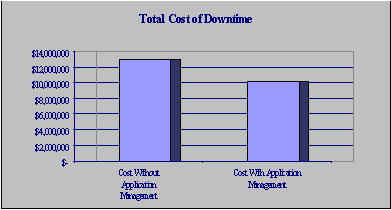
This graph shows the total cost of the ERP downtime, with and without application management tools, on the total life of the system, which is 36 months in this example:
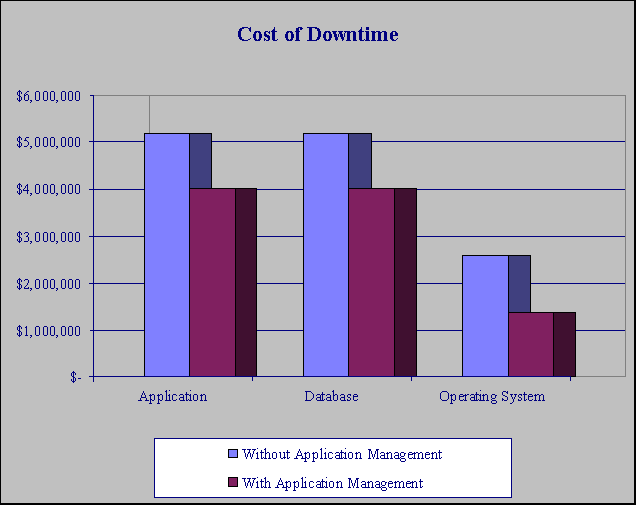
This graph shows the cost of downtime, split by system component, with and without application management products, based on the total life of the system, or 36 months in this example:
Section 3. Examples of Savings
Financial returns
Customers investing in application management tools are frequently Fortune 500 companies with ERP applications that are mission-critical to their business. Customers and resellers report an average payback period for their application management investment of one to two years.
As an example, a manufacturing and distribution customer with 1,000 R/3 users used application management products to reduce downtime. They estimated their first year savings as high as $750,000. In addition, they were able to stabilize their staff, which had been doubling annually, at current levels. The payback for their investment in application management products was a matter of months.
In another example, a network and desktop products and services company with R/3 users throughout the Americas and Europe wanted to reduce operator staff. They employed application management tools to provide a single point of control and were able to reduce the number of operators by five. The company was able to save an estimated cost of $40,000 per operator, or $200,000 the first year.
Our ROI uses a conservative financial assumption: 15% cost of capital. Soft costs are not calculated. For example, reduction in overhead expenses associated with increased productivity, such as reduction in office space requirements or in employee attrition, were not considered. Also, we did not consider any productivity gains of Help Desk personnel.
The financial returns generated by application management products may be higher than indicated here. Only hard costs directly associated with a decrease in unplanned downtime were considered, and we assumed not all the time saved would have been productive time. We also did not consider the reduction in planned downtime or the savings incurred by greater performance for SLAs.
Benefits of application management
The benefits of application management were uniformly clear from our research:
Analysts conclude that the way organizations manage their critical applications to achieve business objectives, including applications availability, performance and service level agreements, will be the key issue affecting their success with ERP applications.
A recent Gartner Group white paper, "Managing Client Server Applications," April 25, 1997, stated "Applications management will provide the IS organization with some of the best returns for the money invested in it. The most significant benefit of managing applications from a user or business perspective is increased applications availability and performance. When focusing on fault prevention, diagnosis, isolation and fast recovery, IS organizations should remember that high levels of availability do not happen without proper planning, investment and management commitment. Reduction of downtime and its inherent costs generally provide the primary justification for the increased costs associated with implementing client server applications management."
"Costs" of management problems cannot be identified with just the cost of operation downtime, although these direct costs are easiest to measure. The costs of reduced service level agreements, lowered staff productivity, personnel turnover, CPU utilization and total recovery time following a disaster must also be considered. Also, there is considerable risk of lowered reputation from both users and customers, which can ultimately affect revenues over time.
The cost of implementing the tools for application management is only a small percentage of the overall ERP systems costs, usually 5% or less.
Reallocation of personnel
Customers have found that fewer administrators are required to manage servers in locations where application management products have been implemented. Therefore, these systems administrators can be redirected to other critical business tasks, resulting in greater productivity not only for the redirected administrators but also for the groups they are now assisting.
This increased productivity, while not obvious to measure, can be significant to a large company.
Here is an example of the cost savings realized by a 10 minute increase in productivity per month for customer representatives at a large telecommunications firm using SAP R/3:
| 10 min/mo | x 8,691 customer reps | x 12 months | x 50 cents/minute | $521,460 annual savings |
Greater productivity can have benefits of reducing the demand for new staff or lessening the burden on outside consultants. ERP expertise is getting more expensive and increasingly difficult to find.
A recent Information Week article, "Crisis Control," February 2, 1998, discussed this dilemma: "Baan expertise is the hardest to find right now. One Baan customer searched for six months before finding a qualified consultant to work on his implementation, ‘It’s nearly impossible to find what you need,’ says Mike May, director of IT at Teknion Furniture Systems, which is completing its year-long implementation of Baan IV software."
Risk assessment
Downtime costs a company more than poor employee productivity. Customers quickly loose confidence in companies when service is down or interrupted, as in this example of a
network outage that affected 2,000 regional customers of a communications service:
| 2,000 customers | revenue: $100/month per customer 2,000 x $100 = $200,000 |
10% lost revenue per month = 200,000 x .10 = $20,000 | annual loss = $20,000 x 12
= $240,000 |
If this loss were multiplied by ten regions, the cost to the company could be millions of dollars.
Risk can be absorbed by individuals as well. As an example, a bank implementing an ERP application for payroll had an outage that resulted in late checks and incorrect calculations on some checks. This outage cost the senior vice president his job.
A large national brewery spent over $500 million attempting to go productive with their ERP installation. When the project failed, the consultants and implementation team members involved were reassigned to less significant projects.
The concept of loss can be extended to reputation costs, which can be heavy as well. A major brokerage house was using a backup program that was inadvertently overwriting information on stocks sold at the same time as the backup was taking place. When they faced an SEC investigation, they found their backups were inadequate and they had to manually recreate the records they needed, at a huge cost of manpower and customer confidence.
There is a lack of standard practices for managing applications as a whole, due to the newness and changing nature of the technologies involved. However, products exist that can manage ERP applications worldwide. They can continue to expand along with the industry itself and meet new technology challenges as they occur.
Section 4. Costs Used in the ROI Spreadsheet
Assumptions of the ROI spreadsheet
Guidelines for estimating other expenses
Which method for ROI is best?
As defined in an IDC (International Data Corporation) study, ROI in the simplest form refers to the annual rate of return on a business investment. It is a standard measure that allows a company to assess the relative attractiveness of several possible investments. It can be mathematically expressed as:
ROI = present value of benefits/present value of costs
It is important to note that ROI can be influenced by other financial factors such as the predicted rate of inflation, cost of money and degree of risk associated with alternative projects.
There are other methods of financial measurement, including Payback Period, Net Present Value and Internal Rate of Return.
Each has strengths and weaknesses, so you may want to consider all four measures. For this white paper, we largely express returns in terms of ROI.
Cost and salary information for external SAP R/3 consultants obtained in January, 1998 from Giga Information Group is shown in the table below.
In the ROI tool we have a place for information for the in-house resources used on the project. Here are some national averages from the 1998 National Data survey: for a DBA $76,100; for a Systems Administrator $60,800; for a Business Systems Analyst $61,200.
Ranges vary by +/-10% depending on the region of the country or world. The fees are for weekday standard hours and do not include holidays, overtime or travel-related expenses.
Giga Information Group Study:
| Consultant Level or Years of Experience | Composite Numbers Cost/Hour | -10% |
+10% |
| <1 yr | $140.00 | $126.00 | $154.00 |
| 1 yr | $165.00 | $148.50 | $181.50 |
| 2 to 4 yrs | $200.00 | $180.00 | $220.00 |
| >4 yrs | $240.00 | $216.00 | $264.00 |
| Manager | $290.00 | $261.00 | $319.00 |
| Program Director | $335.00 | $301.50 | $368.50 |
| Specialist | $360.00 | $324.00 | $396.00 |
| VP/Partner | $450.00 | $405.00 | $495.00 |
Mary Nugent is a business development manager for BMC Software responsible for the Partner relationships with SAP, Baan and Lotus Development. She is a registered CPA with 17 years of experience in accounting and information technology. Before joining BMC Software, she worked as a project manager and consultant for enterprises deploying mission-critical client/server technologies.
Bob Tesh is a BMC Software product marketing manager responsible for the PATROL line of Enterprise Application Knowledge Module products. He has an M.B.A. and 17 years of experience in Information Technology positions, including systems analysis, business analysis, sales and marketing. He has worked for companies providing system integration and software applications products for manufacturing, engineering and distribution customers.
Stephen Payne is a manager in the BMC Software corporate finance department. He is a registered CPA with six years of experience in financial accounting, business analysis and budgeting. Prior to joining BMC Software, he was with the business assurance practice of Arthur Andersen & Co., LLP.
Sources used for this document include:
- "Keeping R/3 Highly Available", A. Dang Van Mien and D. Scott, November 1997
- "SAP R/3 System Management - a Do-it Yourself Opportunity," A. Dang Van Mein, February 1997
- "Managing Client Server Applications," D. Scott, April 1997
- "The Risks of Network and Systems Management Technology," K. Strovink and R. Paquet, September 1997
- "NSM Investments - Why Bother?" K. Strovink and R. Paquet, April 1997
- "Identifying the real Costs of NSM Solutions," K. Strovink and R. Paquet, April 1997
- "ERP Implementation Strategies and SAP," E. Keller, August 1995
- "Andersen Consulting’s Shared Solution Vision," V. Mirchandani, January 1998
Ó 1998 BMC Software, Inc.